At some point in your career, you might have glanced over the Performance tab in the devtools of your favorite browser. You eventually tried to generate a profile but probably got quickly discouraged by it. The high density of information displayed makes it a little overwhelming and somewhat scary. I have been there, I feel you!
Good news is: the learning curve is not actually that steep!!
Once you have grasped a few concepts it suddenly becomes your most valued tool to tackle performance bottlenecks.
This article will give you a few keys to understand how the profiler works and how to make a good use of it.
Let's completely forget about console.log and console.time, today we are diving into the Performance Profiler!
Side note: I won't go too deep into complex scenarios here but I will eventually do a follow up article about advanced techniques.
The data model
The first step that I took to actually understand how the profiler works was to read the Mozilla documentation about their new performance profiler (This is an excellent doc, go read it).
The first waouh effect that I had was when I got to see the data model that the profiler was using. It's actually pretty simple
In Mozilla's documentation, the data model is represented this way:
A A A
| | |
v v v
B B B
  |
  v
CA, B and C are function names and on the X axis we get time. By default Firefox and Chrome's profiler is configured to take a snapshot every 1ms, which means that here every column represents 1ms.
In this example that means that the stack has evolved like this over time
- at 0ms
Awas callingBandBwas still running - at 1ms
Bwas callingCandCwas still running - at 2ms
Chad finished its work and we are back inB - at 3ms the stack was empty
What the profiler can deduce from this is that:
Aalmost instantly calledB;- We stayed ~1ms in
Bbefore callingC; Ctook ~1ms to execute;Btook again ~1 more ms after callingC;Aended right after callingB
with this model in mind, we can create some profile data
A A A A A A A A A
| | | | | | | | |
V V V V V V V V V
B B B B B B B B B
              |
              V
              C
B is taking a bit of time before and after calling C. We spent ~1ms in C and no time in A
A A A A A A A A A
              | |
              V V
              B B
              |
              V
              C
A is taking a bit of time before calling B. B and C are taking ~1ms
The limits of this model
Since the profiler is only taking 1 sample/ms, it means that a function call that takes less that 1ms has a high chance of not showing up in the generated profile.
Let's imagine the following scenario
function A() {
  B(); // < takes 0.5ms // snapshot #1
  C(); // < takes 0.4ms
  D(); // < takes 0.2ms // snapshot #2
  E(); // < takes 0.5ms
}
The generated profile will, most likely, look something like this
A A
| |
v v
B D
There will be no mention of C or E in this profile.
But, well, we are here to debug long tasks, remember? No need to have those fast executing functions in there. We do not care about them!
self time vs total time
One slightly confusing notion in the profiler is the self and total time.
It's actually a notion that can be quite easily understood, though.
They can be defined this way:
selfis the time spent in the function itselftotalis the time spent in the function and all the children functions that it calls
To get a feeling for it, here is a concrete example:
function superExpensive() {
  for (let i = 0; i < 1e10; i++) {
    console.log(i);
  }
}
function main() {
  superExpensiveComputation(); // < takes 1000ms
  for (let i = 0; i < 1e6; i++) {
    // ^ takes 5ms
    console.log(i);
  }
}
main will have a self time of 5ms but a total time of 1005ms.superExpensiveComputation will have a total and self time of 1000ms
The total time helps identify parts of the code that are problematic while self time allows you to narrow down your search to the function that actually requires your attention.
Diving into the UI
With this model in mind, the UI starts making sense. The notions we have seen earlier start to be useful to make good use of the UI.
I am going to focus on the Firefox's profiler here but the same concepts apply to Chrome's profiler as well.
Side note This is an interactive article. When you see a Try me button on the page, feel free to open your Performance tab, start recording and click the button so you can play around with the generated profile. Note that depending on the computer you use it might freeze your browser a bit or be too fast to actually show up in the profile...
Identify long top-level functions: The call tree
Let's take a super simple code sample to get started. Imagine there is a button somewhere and when clicking on it, we trigger the function computeNumber
function generateNumber(nbIterations) {
  let number = 0;
  for (let i = 0; i < nbIterations; i++) {
    number += Math.random();
  }
  return number;
}

function computeNumber() {
  console.log(generateNumber(1e9));
}This is what we will get in our profiler report:

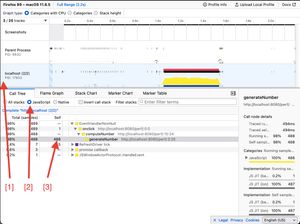
- [1] Since the profiler is actually profiling all the Firefox's processes, we want to make sure we are just inspecting the current web app we are working on
- [2] We are web developer here, no need for the browser's internal stack traces, let's only keep JS stack traces
- [3] We clearly see that we are spending the most amount of time in the
generateNumberfunction (here the function has appeared in 488 samples, which means it has run for, at least, 488ms)
The call tree will allow you to quickly identify which top level functions are taking time. It's a good overview of where to start digging, but it does not help you quickly identify nested functions that have a long self time.
Identify long nested functions: Inverting the call stack
Now, let's consider the following
function computeMultipleNumbers() {
  let number = 0;
  for (let i = 0; i < 10; i++) {
    const fnName = `gen${Math.round(Math.random() * 100)}`; // We create a function with a random name
    const fn = new Function(`function ${fnName}() {
        return generateNumber(1e7);
      } return ${fnName}`);
    number += fn()();
  }
  result.innerText = number;
}The particularity of this function is that it generates named functions with random names. Which means that now generateNumber will be called from many different functions.
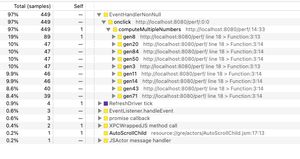
Let's see what the profile looks like

Here we can see that there are many functions called, but they all have an empty self time. Which means this is not the function where we actually spent time, they were waiting for something else to finish.
Now, if we invert the stack.
Here it becomes clear where we actually spent time: in the generateNumber function :)
The inversion actually sorts the function with the highest self time and flatten them at the root of the tree. It's an excellent way to identify a time-consuming function and you get its call stack right next to it. With this you know exactly which function is a problem and from where it was called.
This call tree
topLevel     // self 0
  first      // self 0
  second     // self 0
    third    // self 10
    fourth   // self 7
      fifth  // self 8
Will give you this inverted call stack
third   //self 10
  second
    topLevel
fifth   // self 8
  fourth
    second
      topLevel
fourth  // self 7
  second
    topLevel
So we can quickly identify that we spent ~10ms in third called from topLevel > second
Conclusion
In this article we have covered the basic functions of the profiler. We have seen how to use the call tree and inverted call stack to quickly identify time consuming functions in your application.
Now those time consuming functions are not necessarily the functions that you need to optimize. The problem could lie on the parent function or even higher in the tree. The inverted call stack gives you a good starting point to walk your way up the problematic part of your app.
We have not covered here what the Flame Graph or Stack Chart are, how to profile async code or advanced techniques like markers. This is something I would love to cover in a follow up article. Feel free to ping me on Twitter if this would interest you ;)